
So you've had your fan page for your business for awhile now. You've gained some fans, but you aren't quite getting the response you're looking for, be it general interactions or sales. Reviewing and understanding your Page Insights can really help you change direction, learn from mistakes and correct them!
These screen shots are from our Little Bee Buzz Fan Page. The date range is the last 30 days. I will explain a little on each photo but really getting in there and spending some time looking through your own insights can really help you understand more.
You should be able to click on each photo to bring up a larger version.

This is our page Demographic. You can see from this graph that our largest group of fans are female between ages 25-34. Please note that this is based on age given on their profile, whether it's true or not. ;)
You can also see the number of fans from each country, specific city if their profile allows it, and their primary spoken language. We've noted here that we also have several fans on the other side of the world, so running a few "late night" parties may be key to interacting with them-due to the time difference.
Based on your page demographic you can better understand how to interact with your current fans, who you are most popular with, and where to make improvements if necessary. Aren't getting the sales you're looking for? Try promoting to a different demographic, younger, older, different gender...etc.

These are our page interactions. Blue line is likes, green is comments. You can hover over points on the graph for date and actual numbers. This is useful to see what you're posting that's popular...and what isn't. You can click on "see details" to...well...see more details.

Here are our Interactions Details. This now also shows you a purple line..."unsubscribes". You can hover over points to see dates and exact numbers. For example on June 13th we received 11 unsubscribes...yikes! Luckily you can then go to your page, backtrack through YOUR posts and find out maybe why this happened. Don't worry, we figured it out and it's not something that will happen again! :)
You can also view your recent specific page posts and the feedback generated by them. Note the times of posts also. We posted later in the evening and received less impressions than when we posted a little later. You can also factor in content of the posts. But remember that impressions are the number of people that see it, feedback is the ratio of people that respond to it...either by comment or like. Impressions most likely won't correlate to the content.
Still with us? Let's keep going...
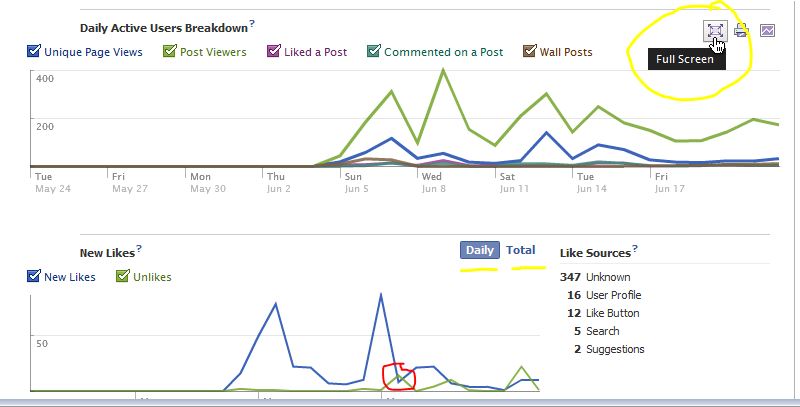
Here is more info on your page interactions (top graph). Now you can note specific activities. You can uncheck any of the colored categories to remove them from the graph. You can also hover in the upper right corner of any graph and view full size, print, or save the image.
On the bottom graph is a report of New Likes & Unlikes. You can choose either Daily or Total. Note the red circle. This day we had several unlikes and a big dip in new likes. This would be a good time to hover on that point, find the date and go see what we did or didn't do that day...and fix it!
You can also view your Like Sources on the right. This also helps you understand where you're promoting is working, or isn't.

Further details on page interactions. Please note that all off these graphs unless otherwise noted show you information for BOTH fans AND non-fans.
Total Tab Views shows you where most of your traffic is venturing. The "My Tab" is our app used for our welcome page. Now if your welcome page is your main landing page for new fans, this number should be high. Our wall views number is very high...to us this means that we have lots and LOTS of loyal fans. Fans that have already liked us and keep coming back. That's GOOD! :)
On the right are your external referrers. This info is helpful in that you can better understand where traffic is coming from, and where you should continue to advertise!

I realize we've sort of gone out of order here. Sorry! This is what you'll see when you first enter your insights. New Likes, Lifetime Likes and Monthly Active Users. You can hover on the small question marks for details on what each means.
Your Lifetime Likes includes business page likes. Most people don't understand this. The "Likes" number on your main page isn't necessarily accurate. Lifetime likes is where it counts. That is the ACCURATE number of people you are reaching. That is the ACCURATE number of news feeds you're showing up in. So don't get hissy if someone visits your page from their business profile but you don't see a like show up as a notification. It's there! Where it counts!
In closing, understanding your facebook insights can truly help you adjust and fine tune to better suit your fans and gain more...and how!
If you have any questions about this you can leave us a comment here, or on our page. Still entirely lost? Email us your saved insights graphs and your questions to LittleBeeBuzz@live.com and we can help you even more!
thanks for the tips!
ReplyDeletefollowing you from blog it forward hop!
would love a follow back and say hellow
http://www.bragallaboutit.com